Red Lake Extension (RLX)
Our goal in Red Lake is to make a discovery outside of the traditional mine trend, guided by a new regional structural model and a keen focus on areas of the Camp which are known to host gold at surface but are largely unexplored.
RLX is a greenstone belt associated with extensive EM conductors and located near the confluence of several major structures in the northern extension of the world-class Red Lake Gold Camp. Through the acquisition of the 23 km2 New Frontier Gold Project (“New Frontier”) (Figure 1) we now control 174km2 of prospective greenstone extensions over deep-tapping regional structures (Figure 2).
A Dominant Land Position Key to Exploration Success in Red Lake
In addition to RLX and New Frontier, we control 100% of the northern extension of the Belt in three additional greenstone areas, the Berens, Taillon and Moreau projects (Figure 1). Finally, through our recent royalty and property portfolio acquisition (see new release dated September 15, 2021) we are the underlying owners of all intervening mining claims which are currently under option to project partners covering an additional 82 km2.
Solstice has assembled a commanding land position in the prolific Red Lake Gold Camp. Our summer work at RLX which included new geochemistry, upgraded property-wide geophysics and field mapping, continue to reveal potential and drill targets along the belt. We plan to provide an update on targeting once final results for these surveys have been received. The Company is funded for phase one drilling at RLX and we look forward to applying our extensive experience and local expertise to advance exploration.
Major Crustal Structures Projected to Surface on Solstice Ground Add Discovery Potential
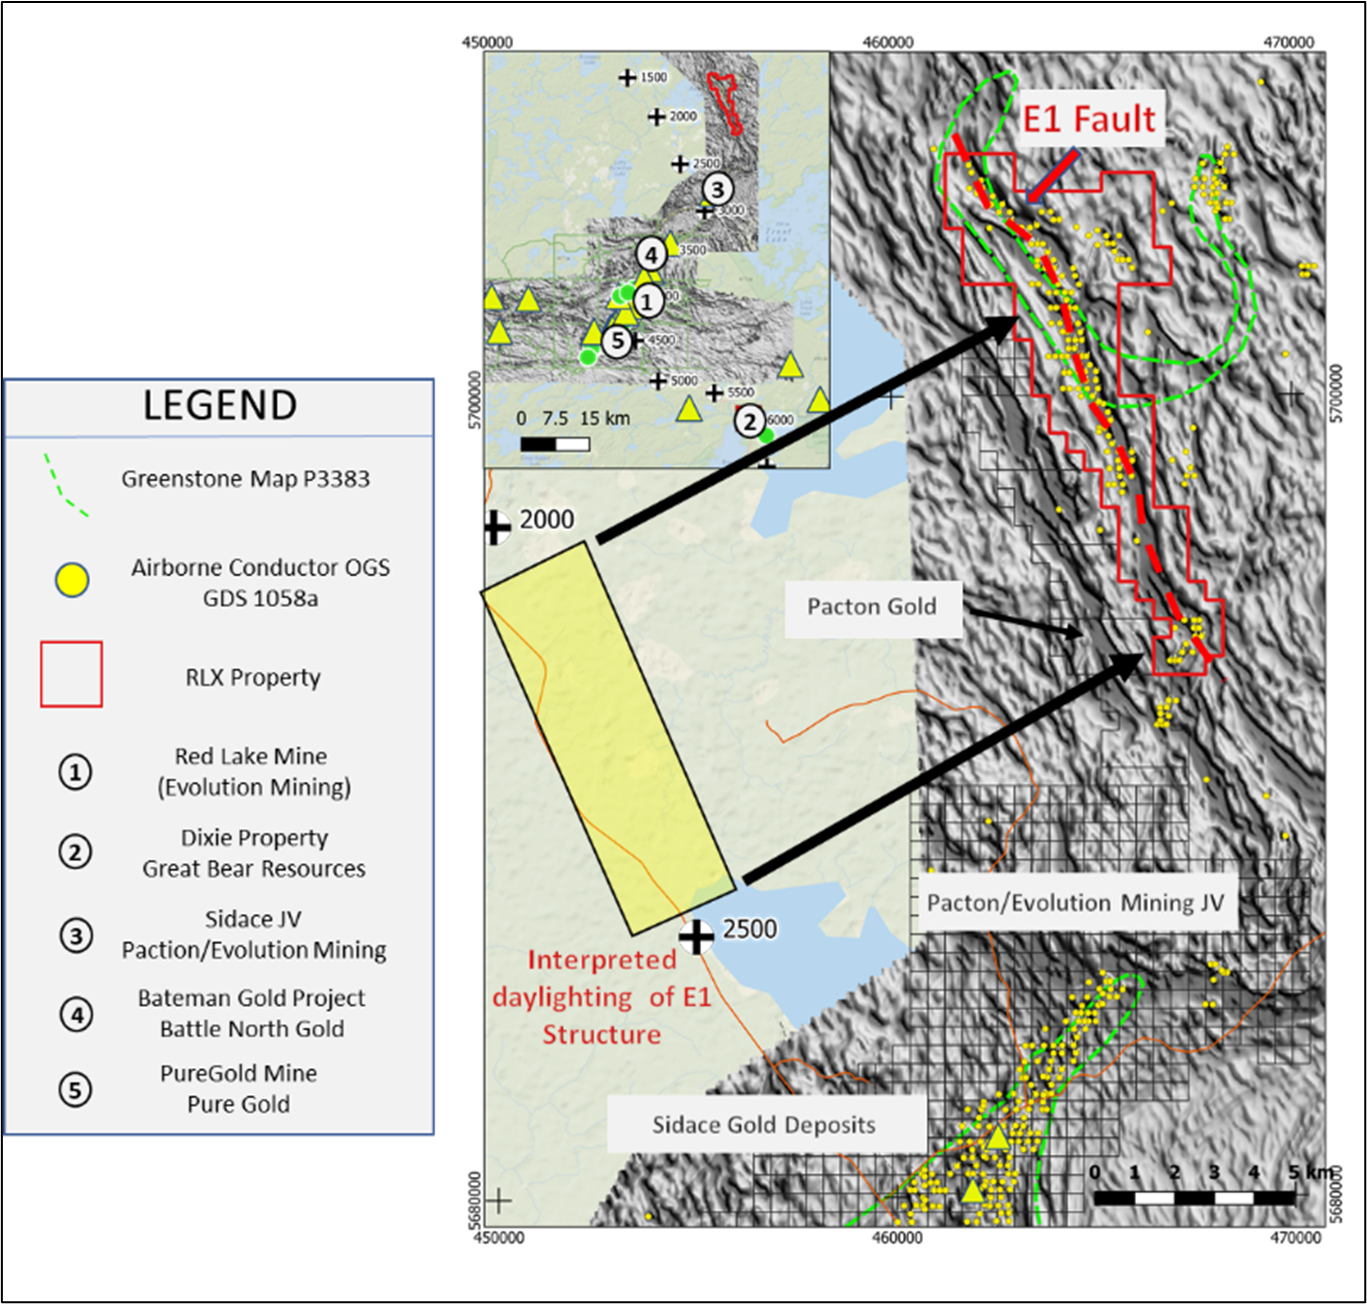
In February 2021, the Ontario Geological Survey (“OGS”) highlighted the northern extension of the Camp in its annual ‘recommendations for exploration’ publication1. In that report the OSG drew attention to the interpretation of seismic profile data2,3. Collectively, these references identify two major crustal features, named E1 and E2. According to the OGS, similar structures further to the south occur close to the Red Lake Mine trend and the Dixie Project (LP Fault) of Great Bear Resources, respectively. Both E1 and E2, may represent major deep-tapping crustal features which, elsewhere in Red Lake are associated with major gold deposits. Solstice controls the surface projections of E1 and E2 at its RLX and New Frontier projects, respectively (Figure 2).
The identification of both the location and significance of major crustal features by the OGS and others in this northern extension of the belt further emphasise the potential of this area for gold discovery. As several third parties have pointed out1,2,3, similar structures occur close to major gold deposits in Red Lake. We have a dominant land position in this new area and thus provide unique exposure to the exploration of the E1 and E2 structures and what is potentially the new frontier for gold exploration in Red Lake.
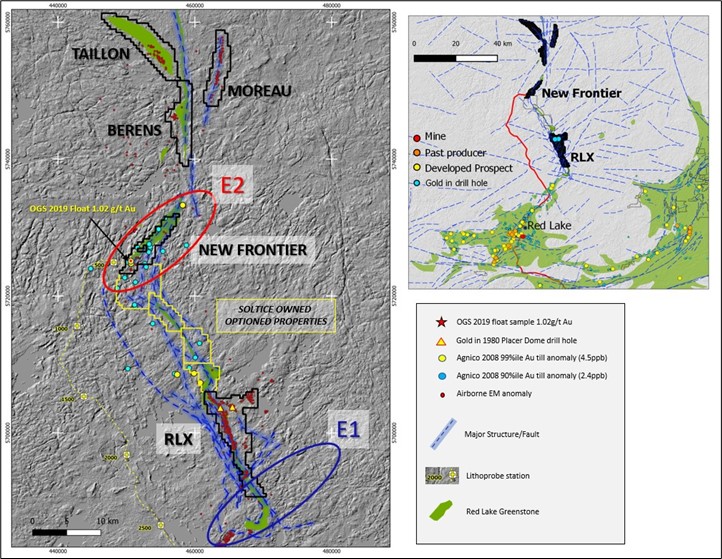
Figure 1: Land position in the northern extension of the Red Lake Gold Camp
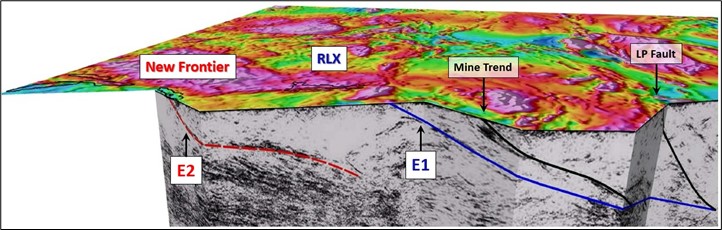
Figure 2: Regional section of interpreted seismic data1 and major structures that underlie the LP Fault, the Mine Trend and the E1 / E2 structures that come to surface at the northern extensions of the Camp controlled by Solstice.: Regional section of interpreted seismic data1 and major structures that underlie the LP Fault, the Mine Trend and the E1 / E2 structures that come to surface at the northern extensions of the Camp controlled by Solstice.
Referenced Sources:
1 Lewis, S.O. 2021. Deep tapping seismic structure in the Red Lake district; in Ontario Geological Survey, Resident Geologist Program, Recommendations for Exploration 2020-2021, p.9-13.
2 Zeng, Fafu and Calvert, Andrew. 2011. Imaging the upper part of the Red Lake greenstone belt, northwestern Ontario, with 3-D traveltime tomography. Canadian Journal of Earth Sciences, v.43. p.849-863. https://doi.o rg/10.1139/e06-027.
3 Calvert, Andrew J. and Cruden, Alexander R. 2004. Seismic evidence for the preservation of the Archean Uchi granite-greenstone belt by crustal-scale extension. Tectonophysics 388 p.135-143
Multi-element soil anomalies on initial test areas
New geological mapping and the identification of numerous gold-arsenic-antimony-mercury anomalies from initial soils surveys at RLX. Based on these results, Solstice fast-tracked an extended soil sampling commissioned a new 75m-spaced electromagnetic (“EM”) survey, results from which will drive subsequent drill targeting and testing.
New geological and soil data reported provide significant encouragement that we are on the right track. RLX covers a minimum of 15 km of potential, which despite being an extension of the prolific Red Lake greenstone belt, is only now being systematically explored for the first time. Once we have completed additional soil sampling and a new EM survey, we will be in a strong position to compile information and select initial drill targets in 2022.
The RLX project is interpreted by Solstice to represent a similar geological setting to the nearby Sidace Gold Deposit (Evolution Mining Ltd. and Pacton Gold Ltd.), located about 10 km to the SW. One of the characteristics of the Sidace gold deposit is its association with a suite of associated elements including arsenic, antimony and mercury1.
The RLX project area contains only local outcrop and is largely overburden-covered. Geological mapping was carried out in concert with test soil surveys designed to evaluate the effectiveness of this method. The program has been successful in identifying permissive geology and identifying gold-arsenic-antimony-mercury soil anomalies that are spatially associated with airborne electromagnetic anomalies.
Geology
Mapping and geophysical interpretation (Figure 3) has identified a 15 km long supracrustal sequence which, as is the case in the main Red Lake belt to the south, has been affected by two main phases of deformation. A unique fold is mapped for the first time at the south end of the property (South Grid) where it is locally associated with iron carbonate alteration and normal (extensional) faulting. Interpretation of seismic (lithoprobe) profiles in 2004 suggested the presence of crustal scale extensional fault systems in the area of RLX that may be potentially important F2 conduits for gold2. Solstice mapping and geophysical interpretation may be the first documentation of this style of faulting in the area.
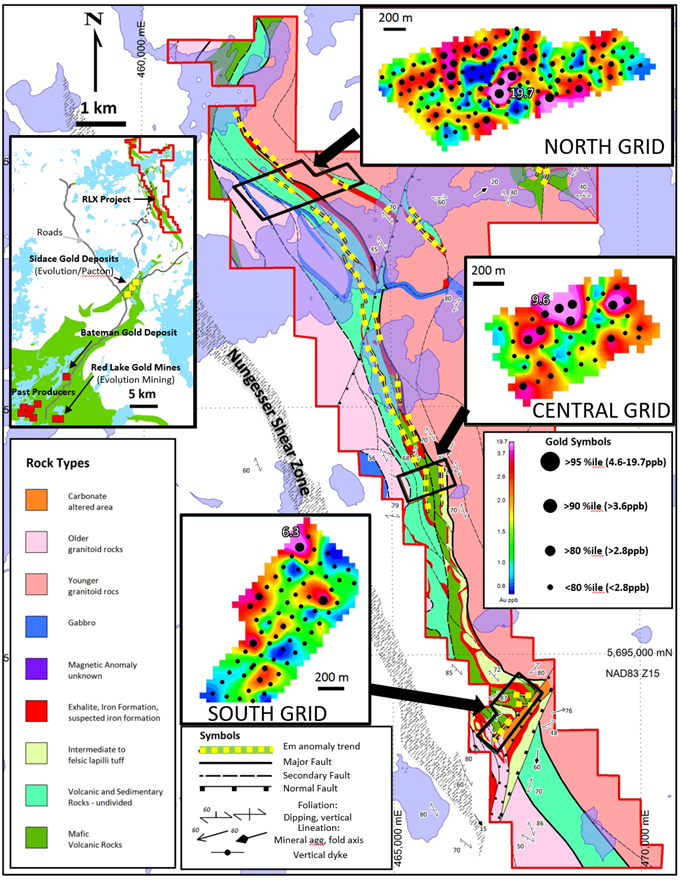
Figure 3. Geological map with Gold-in-Soil gridded and point data for the three test grids.
Test Grid Soil Surveys
Soil sampling was carried out in three test grid areas, North, Central and South (Figure 3). Results are summarized below:
- Coherent gold-in-soil anomalies are present in all three sampled test grids. There is a strong spatial relationship between gold and arsenic-antimony-mercury anomalies (Figure 4).
- Gold-in-soil anomalies are adjacent to, or coincident with, airborne EM anomalies and areas of conductivity (Figure 3).
- Some gold anomalies remain open and likely continue along strike where no soil sampling has been carried out. Only about 15% of the available strike length underlain by conductors and prospective geology is currently covered by soil sampling.
- The North Grid lies approximately 600m NW of a 1989 (Placer Dome) drill hole which reported two separate intervals 1.5 m of 0.68 g/t gold in a sparsely sampled pyrrhotite-bearing intrusive which only partially tests a large EM anomaly in that area.
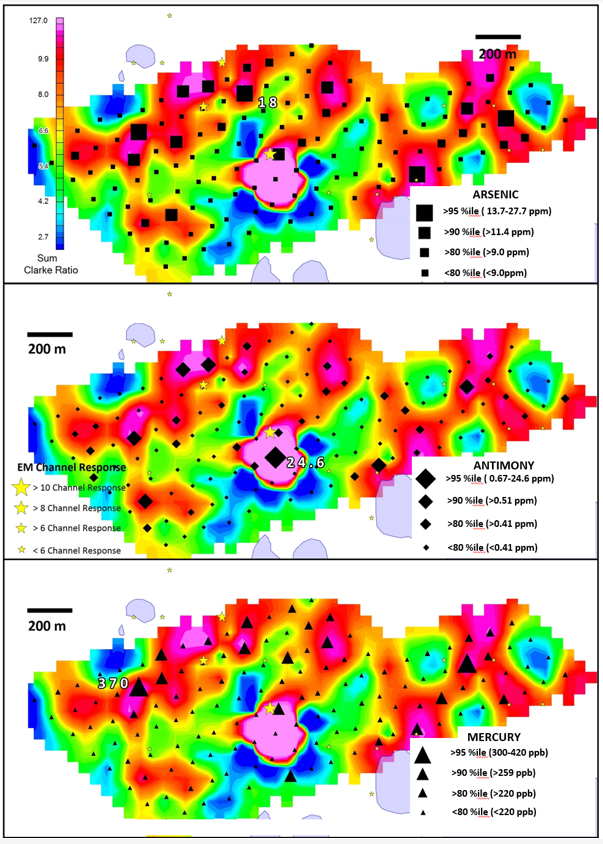
Figure 4. Arsenic-Antimony-Mercury data plotted on gridded sum of Au+Sb+As+Hg values ratioed to their average crustal abundance (Clarke)3. For example: the average crustal value for As is 1.8 ppm, so a soil value of 10 ppm indicates a ratioed value (10/1.8) or 5.6. Ratioing allows elements to be combined to portray the extent of the observed multi-element soil anomaly. See www.solsticegold.com corporate presentation for maps of the central and south grids.
Taken together, results confirm the presence of a 15 km long prospective supracrustal sequence with associated EM conductors and gold (plus arsenic, antimony, mercury) in soil anomalies identified within test survey areas. This element association suggests similarities to the Sidace gold deposit area where such an association is documented.
Given the success of initial soil sampling, Solstice will extend this survey in mid-September, 2021 to cover an additional 11 km of strike length. As well, we have commissioned a new airborne 75m-spaced EM survey designed to both improve coverage and quality (especially signal-noise ratio) compared to the existing 200m-spaced 2008 government survey. The EM survey is expected to take place during October, 2021.
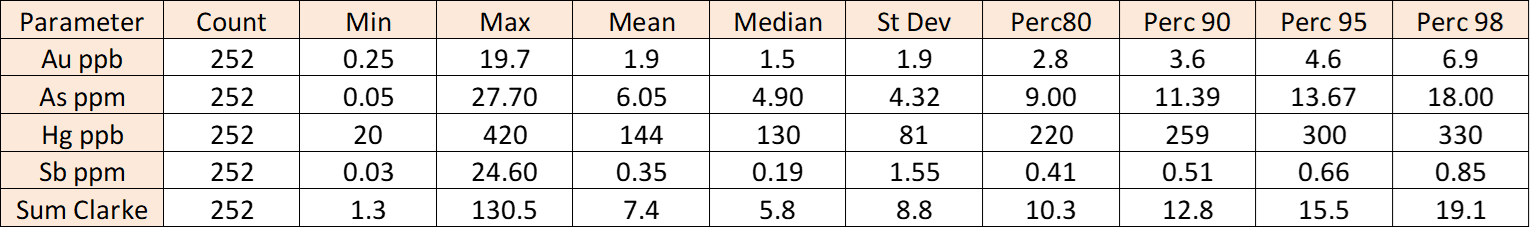
Table 1. Summary statistics – soil data
Soils Sampling protocols.
Sampling and analytical methodology is summarized later in this release and was carried out under the supervision of Colin Dunn P.Geo, Ph.D, an acknowledged expert in this field, supported by WellDunn Consulting Ltd. of Calgary, Alberta. WellDunn Consulting is independent of Colin Dunn and both are independent of Solstice.
Prior to carrying out the survey, various sampling and analytical protocols were reviewed in conjunction with Colin Dunn whose advice was that Ah (humus) sampling and standard Aqua Regia digestion were the recommended methods based on ground conditions and available material.
An approximately 250 g sample of Ah (humus) soil was collected in standard kraft sample bags at 100 metre centres using protocols established by Colin Dunn. Solstice staff were supported in the field by WellDunn Consulting of Calgary, Alberta. Samples were shipped to Colin Dunn at his preparation facility following which they were sieved to approximately 50 mesh (297um) to remove extraneous materials. Approximately 5g of sieved material was sent to Activation Laboratories Ltd. (Actlabs) of Ancaster Ontario. At Actlabs, 0.5g of sample material was digested using Aqua Regia and subsequently analyzed by ICP_MS analysis for 63 elements (package UT1). In addition to internal Actlabs controls, Field duplicate and internal standards were inserted into the sample stream. Actlabs is independent of Solstice and its consultants.
1 http://www.geologyontario.mndm.gov.on.ca/mndmfiles/mdi/data/records/MDI000000001360.html
2 Zeng, Fafu and Calvert, Andrew. 2011. Imaging the upper part of the Red Lake greenstone belt, northwestern Ontario, with 3-D traveltime tomography. Canadian Journal of Earth Sciences, v.43. p.849-863. https://doi.o rg/10.1139/e06-027.
3 Crustal abundances from: 1972: Earth's Crust Geochemistry; p.243-254 in Encyclopedia of Geochemistry and Environmental Sciences, Volume 4A, edited by F.W. Fair bridge, Van Nostrand Reinhold , New York.
4. Evolution Mining NR May 20, 2021. https://evolutionmining.com.au/wp-content/uploads/2021/05/2213595-Completion-of-Battle-North-Acquisition.pdf
Initial Project Compilation at RLX
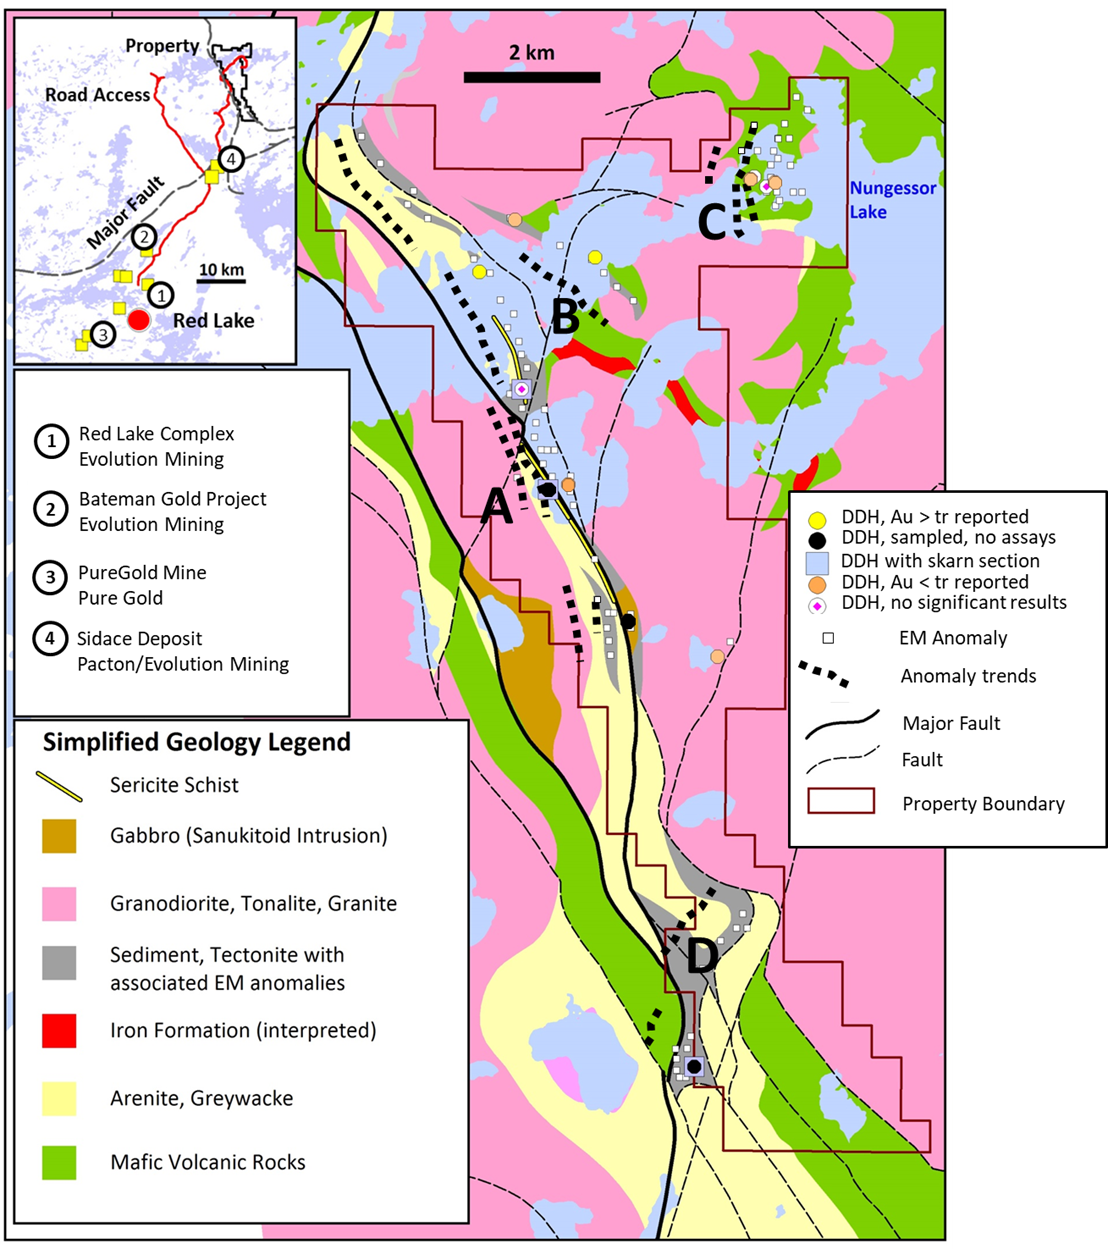
The interpretation utilizes the Company’s recently completed 50 m-spaced magnetic survey combined with previous mapping, electromagnetic and magnetic surveys completed by the Ontario Geologic Survey (OGS)1 and limited drilling completed by Placer Dome in 1980. A preliminary compilation map is presented in Figure 5. Ground programs in May-June 2021 will include mapping, prospecting and soil and biogeochemical surveys of initial target areas.
Summary of Project compilation
Solstice acquired RLX because it is an under-explored extension of the main Red Lake greenstone belt in a similar geological setting to the nearby Sidace Gold Deposit (Evolution Mining Ltd. and Pacton Gold Ltd.). Like Sidace, RLX is characterized by greenstone sequences associated with extensive electromagnetic conductors. In addition, RLX lies at the confluence of several major structures (Figure 5) supported by OGS and other data sources. Recently, Ministry of Northern Development and Mines (“MNDM”) geologists drew attention to the potential presence of a prominent geological structure as the third major structure in the district2. Other similar structures are located close to major gold deposits according to the MNDM. The location of a major crustal structure in the vicinity of RLX is further supported by seismic studies in 20043 and the documented presence of deep-sourced intrusives (Sanukitoids) on the property.
Based on a 2008 OGS 200 metre-spaced airborne EM survey1, we currently recognize four extensive EM trends/target areas A-D (Figure 5). Major NNW-trending faults are part of the Nungessor Deformation Zone (NDZ). Other NNE-trending faults are present. These appear to be rooted in the NDZ. One of these structures (target area D) is observed to extend through the NDZ. The fault(s) in this area may extend to the Sidace gold deposit area and at RLX are associated with NE-trending EM anomalies and possible rotation of stratigraphy. In 1980, Placer Dome drilled 12 short drill holes (1352m) on the property representing very wide-spaced tests. According to logs and filed location data in assessment files, four of these drill holes either did not test their intended target or were drilled in the wrong direction. All holes appear to be under-sampled with only 10% of the material being assayed despite descriptions of extensive sulphide mineralization in the drill logs. Despite this, two drill holes intercepted gold (0.68g/t in three sampled sections totalling 10 feet). A further two drill holes were sampled but assays were not reported in filed assessment logs. Drill logs note the presence of felsic volcanics over 1.5km strike length (open) and three drill holes report well mineralized skarns. Collectively, these observations lend support to an environment similar to Sidace where the aforementioned features are also observed.
2021 Ground Based Exploration Program
Mapping and prospecting designed to further evaluate the initial target areas and to upgrade project geology is headed up by Solstice lead geologist, Sandy Barham. Sandy has over 30 years of experience running field programs and his work has successfully led to the discovery and development of multi-million ounce gold deposits.
We shall also be carrying out soil and biogeochemical sampling surveys over four initial target areas. Because we expect relatively deep overburden in the area of EM conductors, these surveys are designed to test for a geochemical response in humus (Ah soil horizon) and/or certain tree/shrub species. The design and interpretation of this work will be conducted under the supervision of a leading expert in the field of Biogeochemistry, Dr. Colin Dunn.
Despite the property having seen only cursory exploration to date, we do know gold is present along with extensive sulphides and alteration which we believe may be analogous to the geological setting of the Sidace gold deposit. It is interesting to note that, like RLX, Sidace was also explored by Placer Dome (1979) who reported some gold in drilling. However, it would be 20 or so years later before the Sidace deposit was discovered.
1. Ontario Geological Survey 2008. Ontario airborne geophysical surveys, magnetic and electromagnetic data, grid and profile data (ASCII and Geosoft formats) and vector data, Whitefeather forest area, GEOTEM 1000 survey, Ontario Geological Survey, Geophysical Data Set 1058a.
2. https://www.mndm.gov.on.ca/sites/default/files/recommendations_for_exploration_2020-2021.pdf
- OGS: Stone D. 1998. Precambrian geology, Trout Lake area; Ontario Geological Survey, Map P.3383. scale 1:250 000
- MNDM Interpretation from: Lewis, S.O. 2021. Deep tapping seismic structure in the Red Lake district; in Ontario Geological Survey, Resident Geologist Program, Recommendations for Exploration 2020-2021, p.9-13.
- Original Seismic Interpretation from:
- Zeng, Fafu and Calvert, Andrew. 2011. Imaging the upper part of the Red Lake greenstone belt, northwestern Ontario, with 3-D traveltime tomography. Canadian Journal of Earth Sciences, v.43. p.849-863. https://doi.o rg/10.1139/e06-027.
3. Calvert, Andrew J. and Cruden, Alexander R. 2004. Seismic evidence for the preservation of the Archean Uchi granite-greenstone belt by crustal-scale extension. Tectonophysics 388 p.135-143
4. Evolution Mining NR May 20, 2021. https://evolutionmining.com.au/wp-content/uploads/2021/05/2213595-Completion-of-Battle-North-Acquisition.pdf
Three New Projects Triples Its Red Lake Land Position
The Company has acquired through staking an additional 9,461 Ha (484 claim units) comprising three new projects; Taillon, Moreau and Berens (the New Projects), approximately 30 km north of our RLX project (Figure 6). Our Red Lake land holdings are now three times the size we had prior to the new staking. Key features of the new acquisitions are summarized below:
- Two of the new projects (Taillon, and Berens) have been mapped as greenstone and extensions of the Red Lake greenstone belt by the Ontario Government Survey (“OGS”).1,2 Our third project (Moreau) was staked to cover nearby extensive EM anomalies which occur over an approximately 5km strike length. According to the OGS1, the Taillon area are “correlative with the Balmer assemblage rocks in Red Lake”. Most of the major gold deposits in Red Lake are located within Balmer assemblage rocks.
- Along with our RLX project, acquired in February, 2021 (see our February 4, 2021 news release for details), Solstice now controls three of the four known greenstone trends which extend northwards from the main Red Lake belt.
- Collectively, our four projects cover most of the known EM conductors in the area3 (See Figure 6).
- All of our projects, including RLX, are associated with interpreted major structures (Figure 6). In January, 2021, the OGS4 pointed to the potential significance of fault structures in the area which they suggested may represent a possible third major structure in the Red Lake belt, the other two being interpreted by the OGS to generally correlate with the location of two major gold deposits in the Red Lake camp.
- There is no record of previous exploration in the new project areas despite them being extensions of the Red Lake greenstone belt.
- Collectively, we now control 15,175 Ha (759 claim units) in this emerging exploration play.
The January 2021 OGS exploration report4 triggered major staking in the area of the interpreted greenstone extensions over a 50km strike length. At the same time, we targeted the greenstone closest to the main Red Lake belt based on our interpretation of public domain data and our historical familiarity with the Sidace gold deposit area (Evolution Mining/ Pacton (39%). We believe RLX represents a similar setting. We targeted Taillon, Moreau and Berens using the same rationale. They comprise extensions of the Red Lake belt, contain extensive EM anomalies and are associated with major structures evident. Significantly, given the well-known gold endowment of the Red lake belt and the intensely competitive nature of staking in the belt, there is no record of previous exploration in the three new project areas despite their obvious lineage.
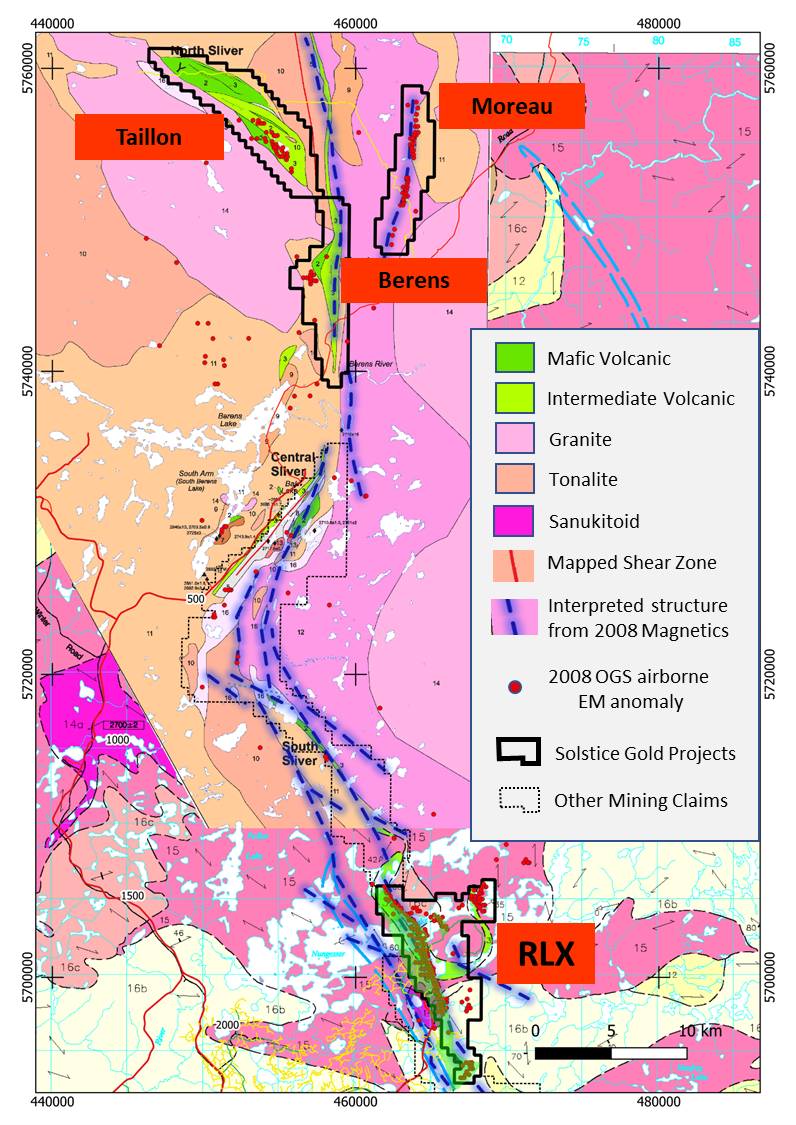
Figure 6. Location Map for newly acquired properties. Compilation map is by the OGS1,2, airborne EM anomalies are from 2008 surveys by the OGS 3. Interpreted major structures (blue lines) are by Solstice based on interpretation of magnetic and EM datasets. Lake conductors in Berens Lake omitted from figure.
1 Buse, S. and Préfontaine, S. 2007. Precambrian geology of the McInnes Lake greenstone belt, the supracrustal remnants study area and the Frame Lake pluton, Berens River Subprovince, Ontario; Ontario Geological Survey, Open File Report 6210, 128p.
2 OGS: Stone D. 1998. Precambrian geology, Trout Lake area; Ontario Geological Survey, Map P.3383. scale 1:250 000
3 Ontario Geological Survey 2008. Ontario airborne geophysical surveys, magnetic and electromagnetic data, grid and profile data (ASCII and Geosoft formats) and vector data, Whitefeather forest area, GEOTEM 1000 survey, Ontario Geological Survey, Geophysical Data Set 1058a.
4 https://www.mndm.gov.on.ca/sites/default/files/recommendations_for_exploration_2020-2021.pdf MNDM Interpretation from: Lewis, S.O. 2021. Deep tapping seismic structure in the Red Lake district; in Ontario Geological Survey, Resident Geologist Program, Recommendations for Exploration 2020-2021, p.9-13. (Refers to an Original Seismic Interpretation from: Zeng, Fafu and Calvert, Andrew. 2011. Imaging the upper part of the Red Lake greenstone belt, northwestern Ontario, with 3-D traveltime tomography. Canadian Journal of Earth Sciences, v.43. p.849-863. https://doi.o rg/10.1139/e06-027.)
5 Battle North Gold Bateman Gold Project, current Feasibility Study includes resources of M&I 985,400 oz Au @ 6.04gpt and Inf 272,200 oz Au @ 6.5gpt
OGS DATA ON RLX CLAIM POSITION
While the OGS interpretation of seismic data is compelling, additional independent data exist in government files which support the presence of a major structure in the area, which are summarized below and in Figure 7.
- OGS magnetic data (2008)2 allow identification of clear crustal scale features. Well-developed linear magnetic features, which are related to regional faults can easily be discerned using OGS airborne magnetic survey data (see Solstice NR dated February 2, 2021, for a regional magnetic map and also our corporate presentation at https://www.solsticegold.com/investors/presentations/).
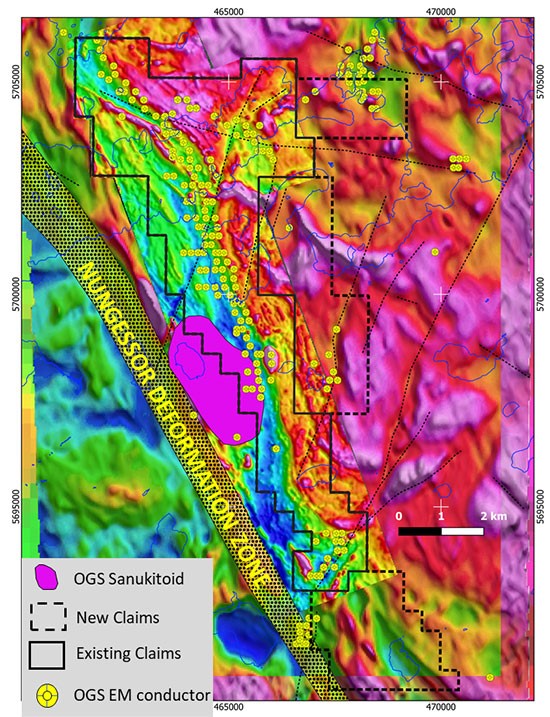
- OGS mapping in 19983 identified a major regional structure. The Nungessor Deformation Zone is a major fault zone (mylonite) which is mapped parallel to, and on the west flank of, the RLX property (Figure 7)
- A specific rock type, formed at depth and associated with major crustal faults, has been mapped on the property boundary by the OGS4. This rock type, called sanukitoid, was sampled and confirmed in 2000 by the OGS. These rocks are documented from the Archean worldwide. Their significance is that they are formed, in part, from melting of the mantle i.e. very deep in the earth, and as documented elsewhere "their very presence in outcrop identifies a translithospheric structure"5 Although no age data are available for the Nungessor sanukitoid, other similar rock types regionally are dated around the same age as the major gold mineralization event in the district.
Taken together, the presence of a mapped major fault and the documentation of specific intrusive rocks which are themselves diagnostic of major crustal features both support, and are mutually independent of, the recent OGS interpretation based solely on seismic data.
It is well documented that major gold deposits in the Archean of Canada and elsewhere occur close to major structures or breaks. These structures have potential to tap deep into the earth to source potential metals, including gold, and to create the higher-level conditions required to deposit or trap these metals. It is clear from third-party data that our RLX project sits close to one such major structure. We interpret RLX to be in a setting similar to the Sidace Gold Deposit clams (Paction/Evolution Mining), 11km to the south which also contain similar, extensive EM conductors. We have just completed a detailed 50m-spaced magnetic survey and are re-evaluating the EM data through a third-party consultant. We are also developing plans, again using an expert third-party consultant to employ soil and/or biogeochemistry surveys over the anomalies.
Existing government surveys show a first order structure and numerous other structural features associated with extensive conductors (Figure 8). Given that gold deposits in the region are associated with specific structures, the ability to obtain high definition, cost-effective magnetic data will be an important step in allowing us to refine and potentially locate additional structures and targets.